


Use Cases 2
How to measure section speed and gap times and gather traffic event evidence
Section speed and gap time violation evidence gathering guide! Learn how to set it up in 3 simple steps.
Evidence is a feature available from FLOW version 1.16 that allows you to export reports of different traffic events including traffic violations such as speeding, not maintaining sufficient time gaps between vehicles, U-turns, stop signs, and red-light running, and more. In this tutorial, we will demonstrate in 3 steps how you can set up evidence gathering for section speed and gap time measuring. First, we will go over how to set up the spatial and other necessary filters and then we will show you how to set up evidence report generation and also how to access the reports. NOTE: The Evidence module must be enabled by the administrator.
Step 1. - Creating spatial filters
Create 2 gates, one at the start and one at the end of the road section for which we want to gather section speed data. Make sure that the gates are parallel. Next, we draw a movement between the two gates. When setting up the movement, we also need to put in the distance between the two gates in meters. You can find the field for the movement Length next to the movement name field. Please note that the Length defines the length between the two gates, not the actual visual length of the movement you see in the video analytics setup view.
Step 2. - Creating section speed data filtration chain
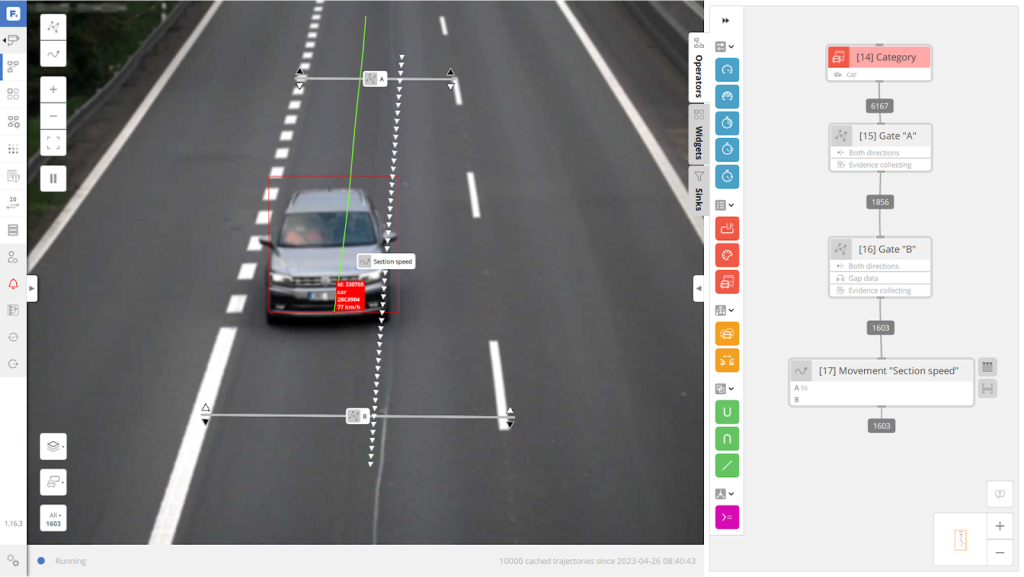
Next, we need to instance the gates and the movement in the canvas. To do that, we drag them over to the canvas and connect them as shown in the image below. As you can see, we also put a category filter there to only count passenger vehicles, aka the car class. Once you have added the category filter, gates, and movement and connected them in the correct order, we need to adjust the individual gate settings.
To gather snapshots for the section speed evidence, we need to tick Collect Evidence under the Time mode and Evidence on each gate. You can access the gate settings by double-clicking it. On the second (exit) gate, we also tick Calculate gap under Gap data, which will allow us to get the gap time and gap distance between the two gates.
Last and most importantly, add a table widget to the end of the filtration chain (on the movement in our case). This table will gather data on all the objects that meet the filtration conditions and will be used as input for Evidence generation.
Step 3. - New evidence task setup
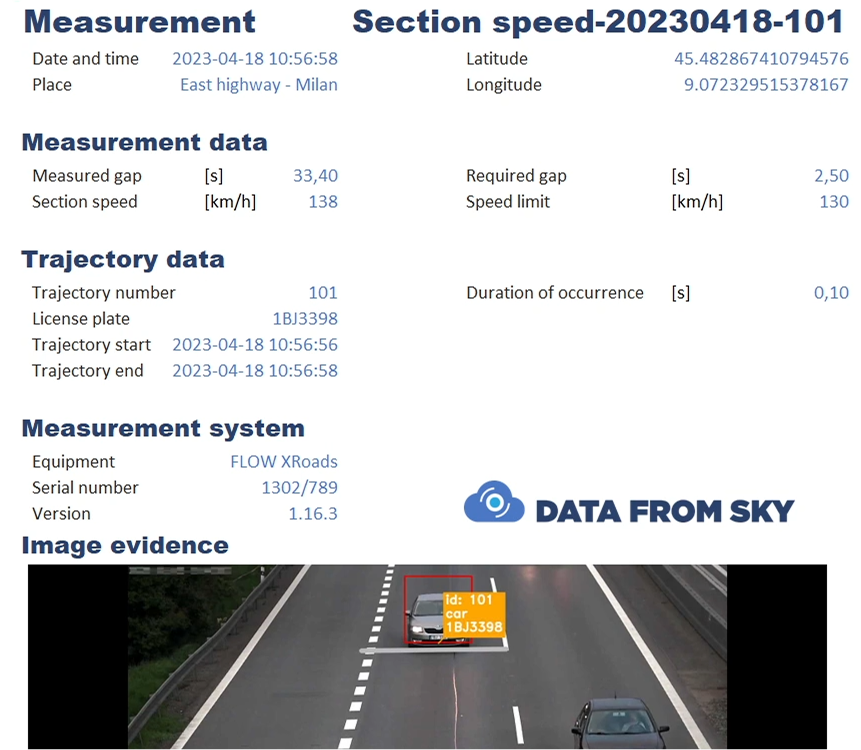
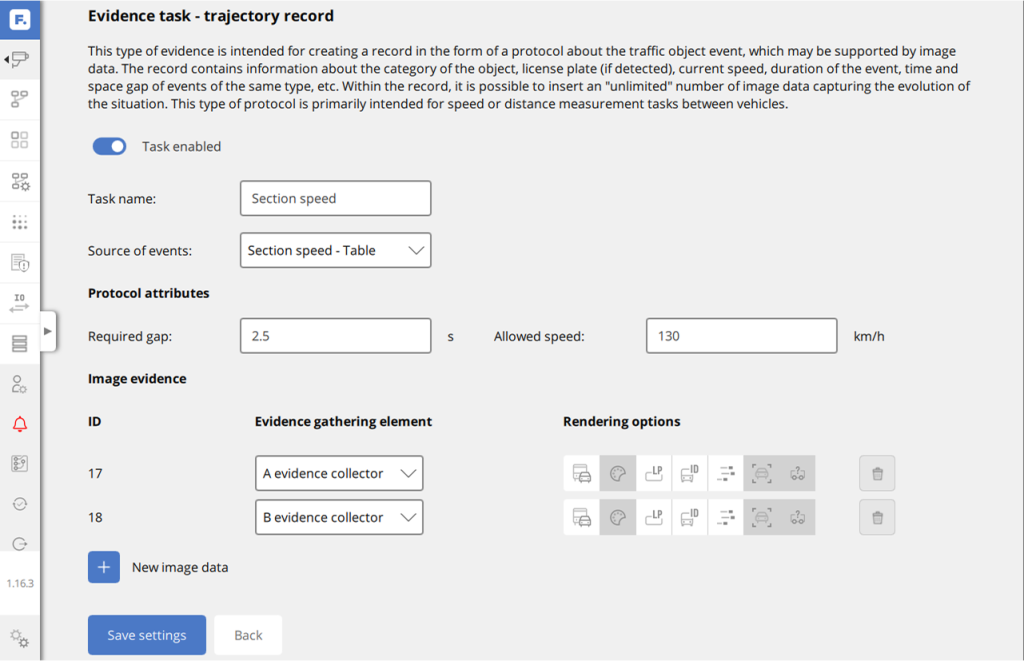
Go to the Evidence section of the specific video analytics and click on the New Task button. Under Source of Events, select the table widget we have created. In the Image Evidence section, click on New Image Data and add the two gates we have selected for visual evidence gathering. In the Protocol Attributes part, you can set the thresholds for gap time and speed. If the given object goes over them, it will be highlighted in the report.
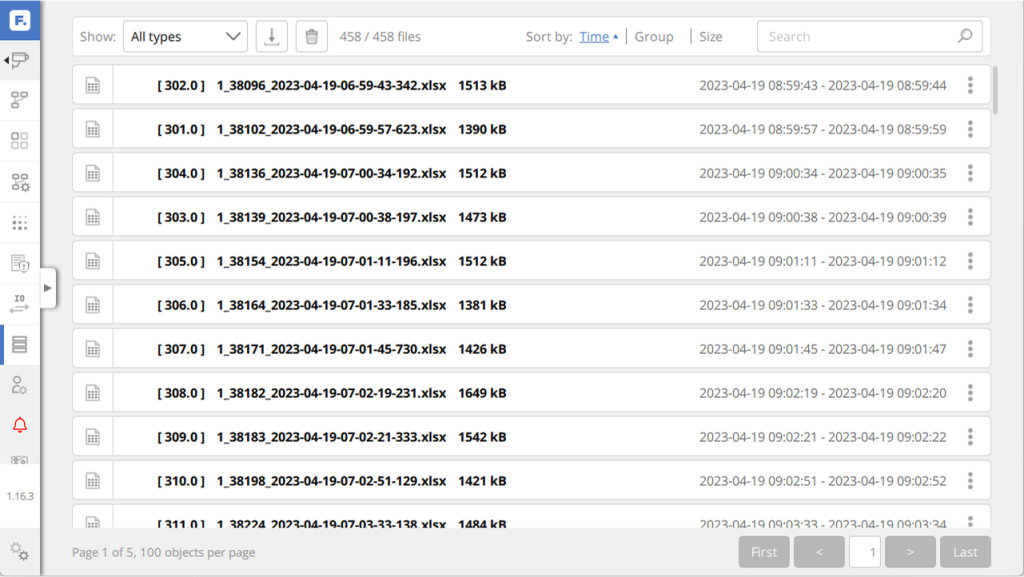
Now you are generating .xlsx section speed evidence reports! You can access and download them in the Storage section of the given analytics.