


Use Cases 3
Creating an OD matrix - How-To Series in FLOW Insights
Article on how-to get turning movement counts by creating OD matrix and exporting the data into an excel file.
Introduction
Origin-Destination (OD) matrix is an important tool for traffic analysis. OD matrices are useful for analyzing the directions of traffic flow and for measuring the level of service. Definition of an OD matrix is super easy in FLOW Insights, and the data is unique as you don’t only get historical data but also real-time data.
When you have OD data, you can set up traffic light signals for each direction based on it without the need to hire a traffic engineer. You can even use the OD data to adjust the traffic lights in real-time according to the current traffic flow.
This article will show you how easy it is to generate an OD matrix with category filtering and a dashboard visualization in FLOW Insights. You will also learn how you can publish the data via the API for traffic management.
What will you learn from this article?
- How to set up input gates for OD matrix.
- How to create OD matrix and export excel report.
- How to publish data with API.
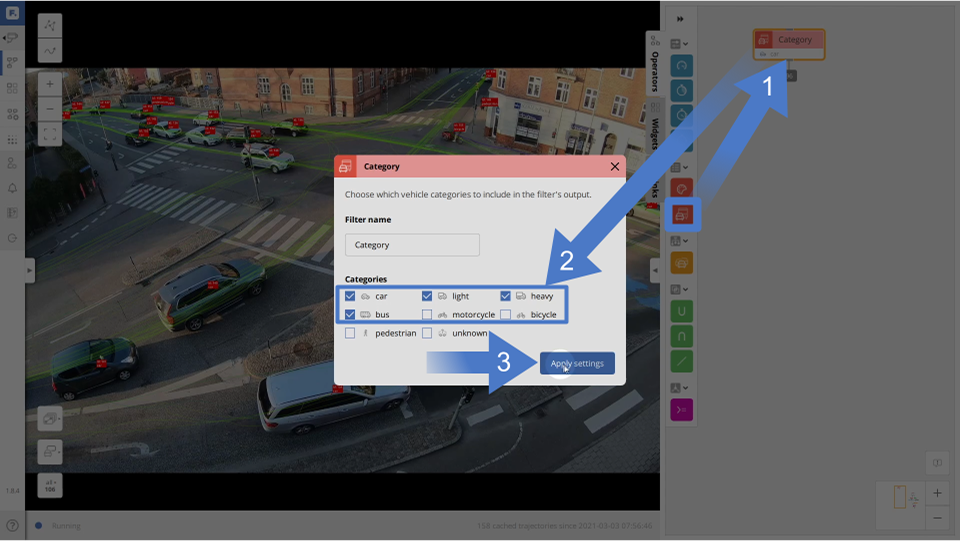
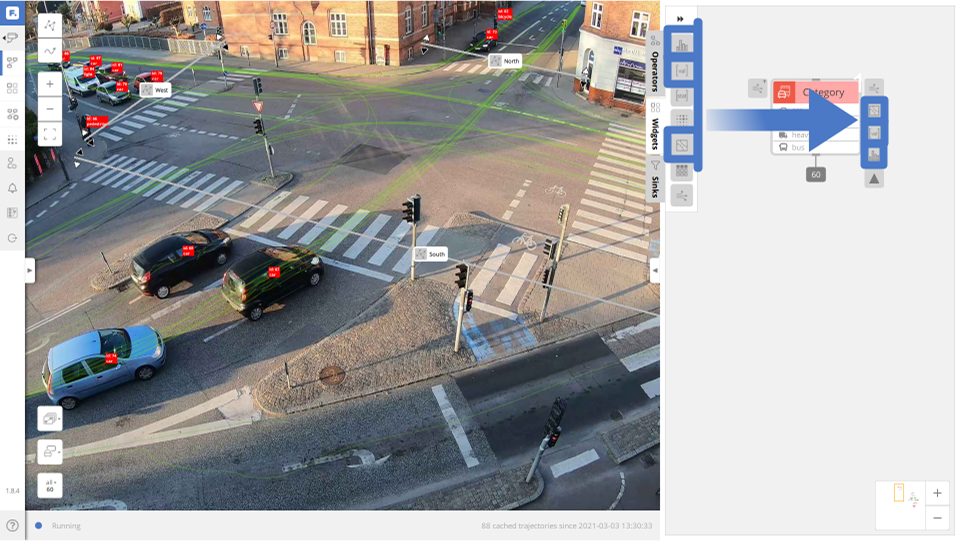
First, we will create a category filter in the canvas and select cars, light, heavy, and bus categories.
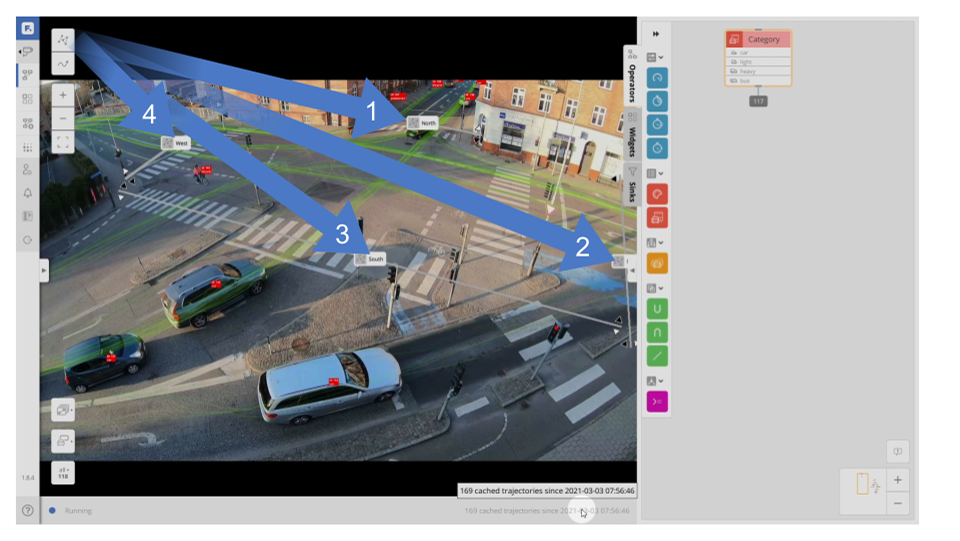
Next, we will draw 4 gates in the junction—one for each direction. We need to be careful to draw each gate so it covers the whole direction. For example, for the bottom-side gate, we need to stretch it to the right, as there is a separate traffic lane for turning right.
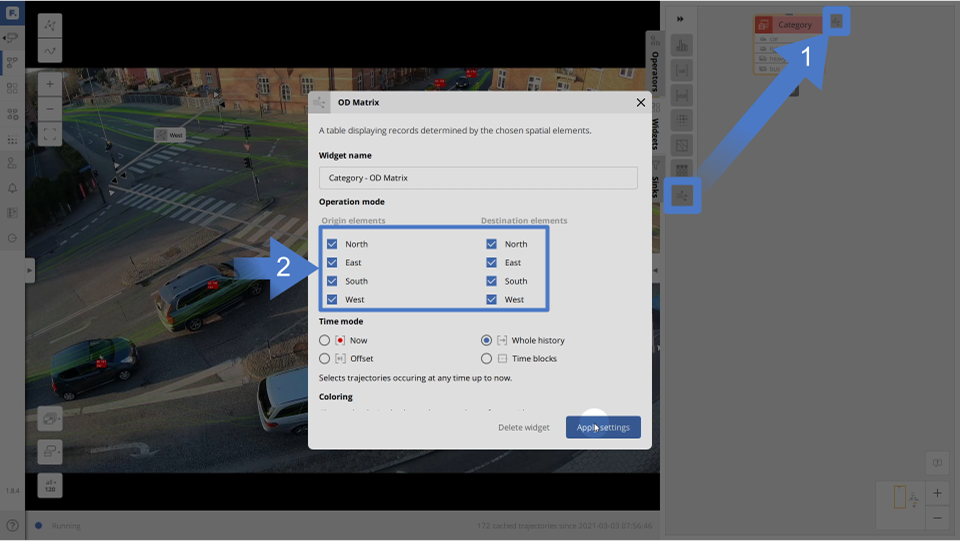
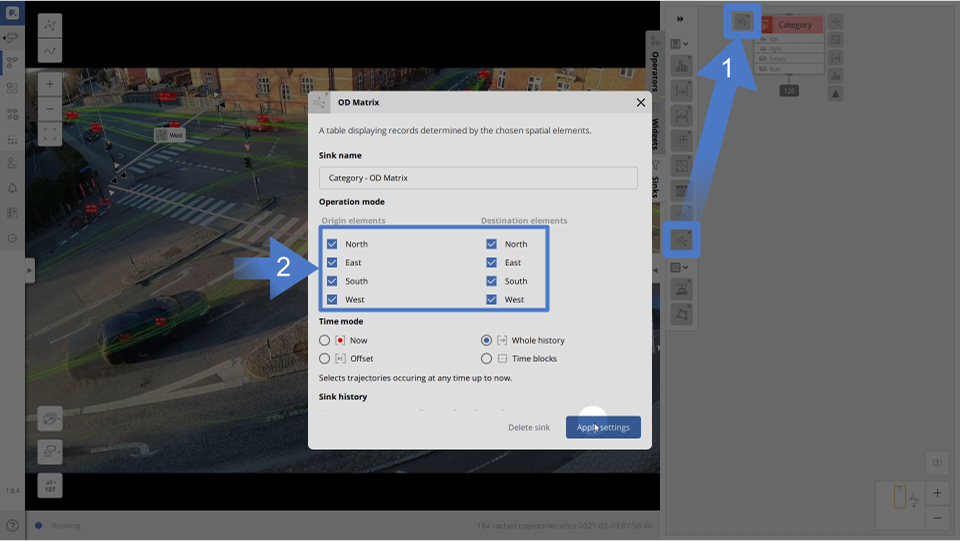
Now we can add the OD Matrix widget to the category filter. We tick all the gates we want to use as origins and destinations. In this case, we tick all of the gates so we get all of the possible turning options for the junction.
You can also filter the data time-wise using the widget time settings, which allow you to select data from the whole history, last day, last hour, 1 hour back, 5 hours back, etc.
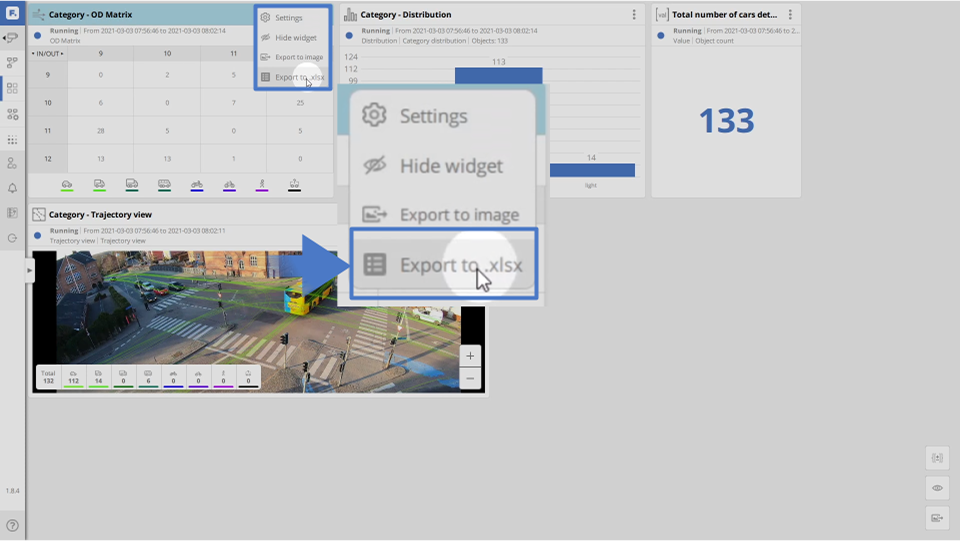
To have a nice overview of the situation we also add a trajectory view widget, value widget, and distribution widget to the category filter
We can export an excel spreadsheet of the OD Matrix/table by clicking on the 3 dots in the top right corner of the widget in the dashboard and select export to .xlsx.
We can also communicate this data via API for example to a smart city platform or to a traffic control system for real-time traffic management.
Conclusion
You have learned how simple it is to create an OD matrix with FLOW Insights by simply drawing gates and selecting which ones you want to use as inputs for the matrix creation. The OD data can be calculated for defined time periods and real-time streamed to the traffic controller for adaptive signal timing or to a smart city platform for traffic monitoring.
We offer multiple real-time solutions that run FLOW, each suitable for different scenarios. We have the plug-and-play TrafficCamera, which is perfect for simple scenarios such as straight two-lane roads. For more complex traffic scenes, we provide the TrafficEmbedded, which gives super-detailed data for more complex scenes on a single camera but can support up to 6 cameras. Both the TrafficCamera and TrafficEmbedded process data on the edge.
You can even use an unlimited number of existing city cameras with our TrafficEnterprise solution, which processes the data in the cloud or on a city server and manages traffic flow across the whole city.